



D.02 — Responsive redesign & frontend
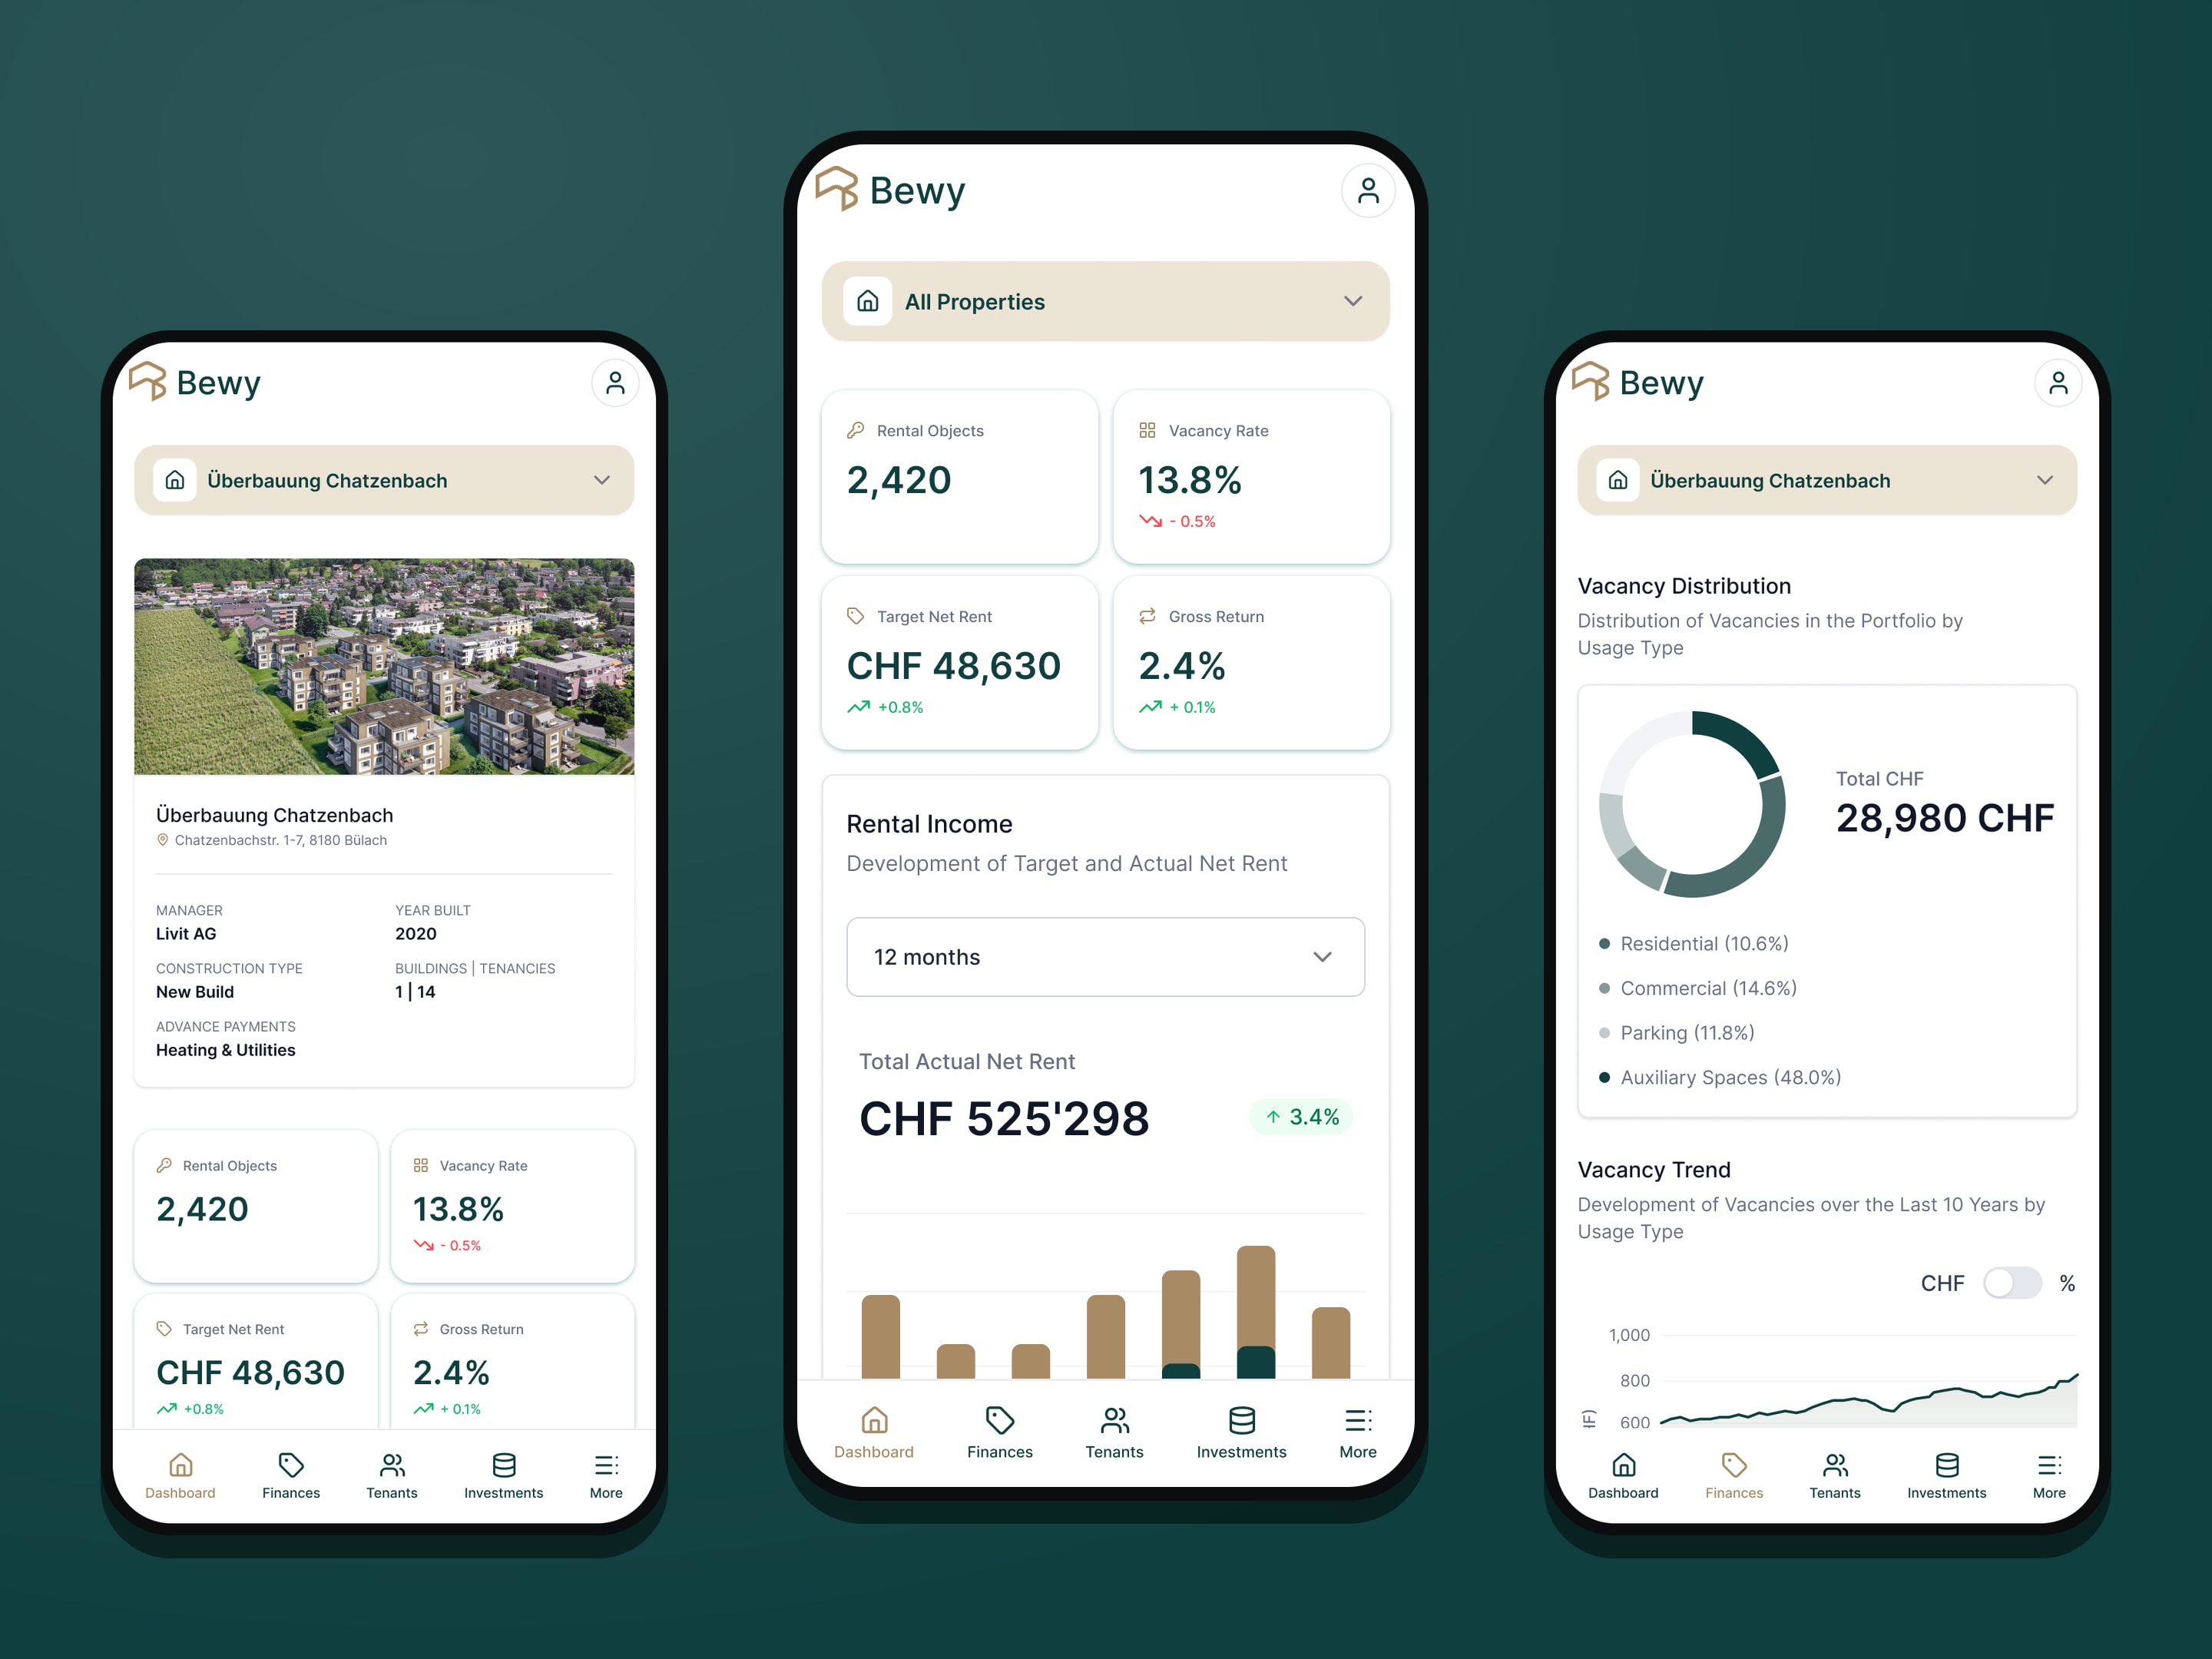
Every key figure of a property portfolio, in an owner's pocket.
- Client
- Bewy AG
- Sector
- Digital property management
- Country
- Switzerland
- Role
- Product design & frontend engineering
- Tools
- Figma · React
- Deliverables
- Full dashboard redesign · Responsive mobile & web
01 — Context
The client, and what I was asked to design.
The client
Bewy AG is a Swiss property-management company that pairs experienced managers with digital tools, to make managing property simpler, faster and more transparent.
At its centre is the owner portal: owners see every key figure for their properties in real time, around the clock.
The brief
I redesigned Bewy's property-management dashboard to work on mobile, responsive across the whole platform, and built most of its React frontend.
The challenge was density: portfolios, buildings, rents, vacancies and tenants, all readable on a phone. Each screen leads with four headline figures, then charts and detail on demand, with the main areas one tap away in the tab bar.
02 — Selected screens
A few screens from the mobile design.
Each screen sits in its own phone. Scroll or swipe inside one to move through it; the tab bar stays put, as it would on a device.
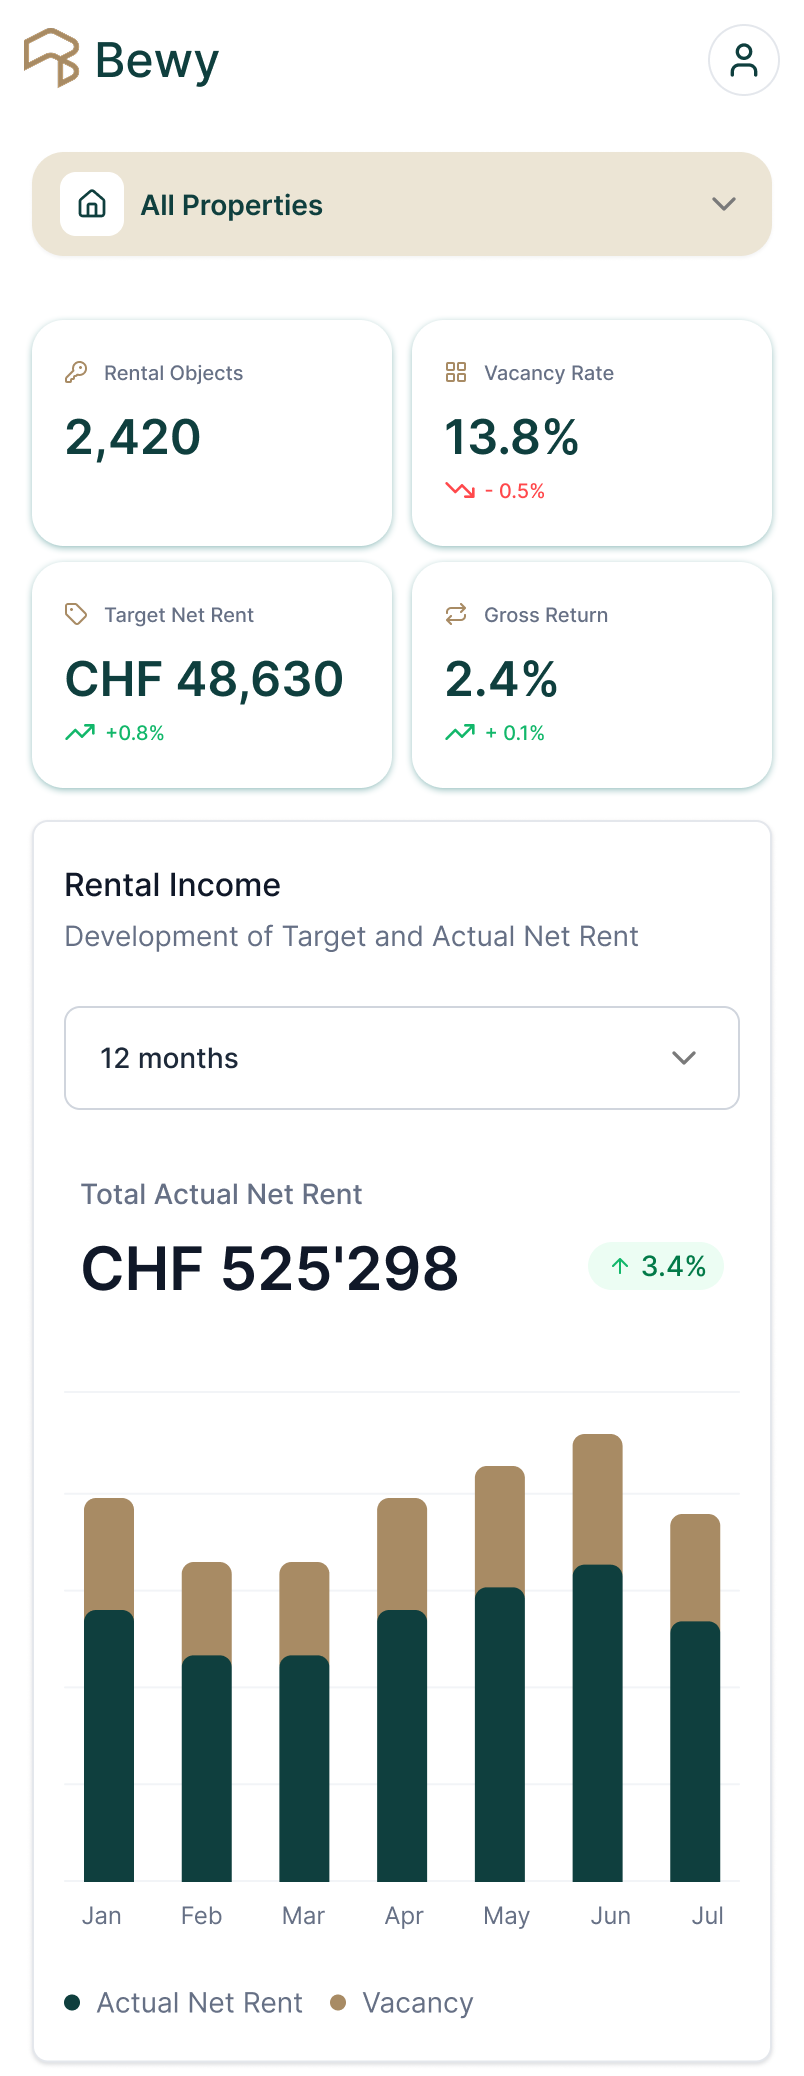

Screen 01
Portfolio
All properties at a glance: rental objects, vacancy rate, target net rent and gross return, then rental income month by month.
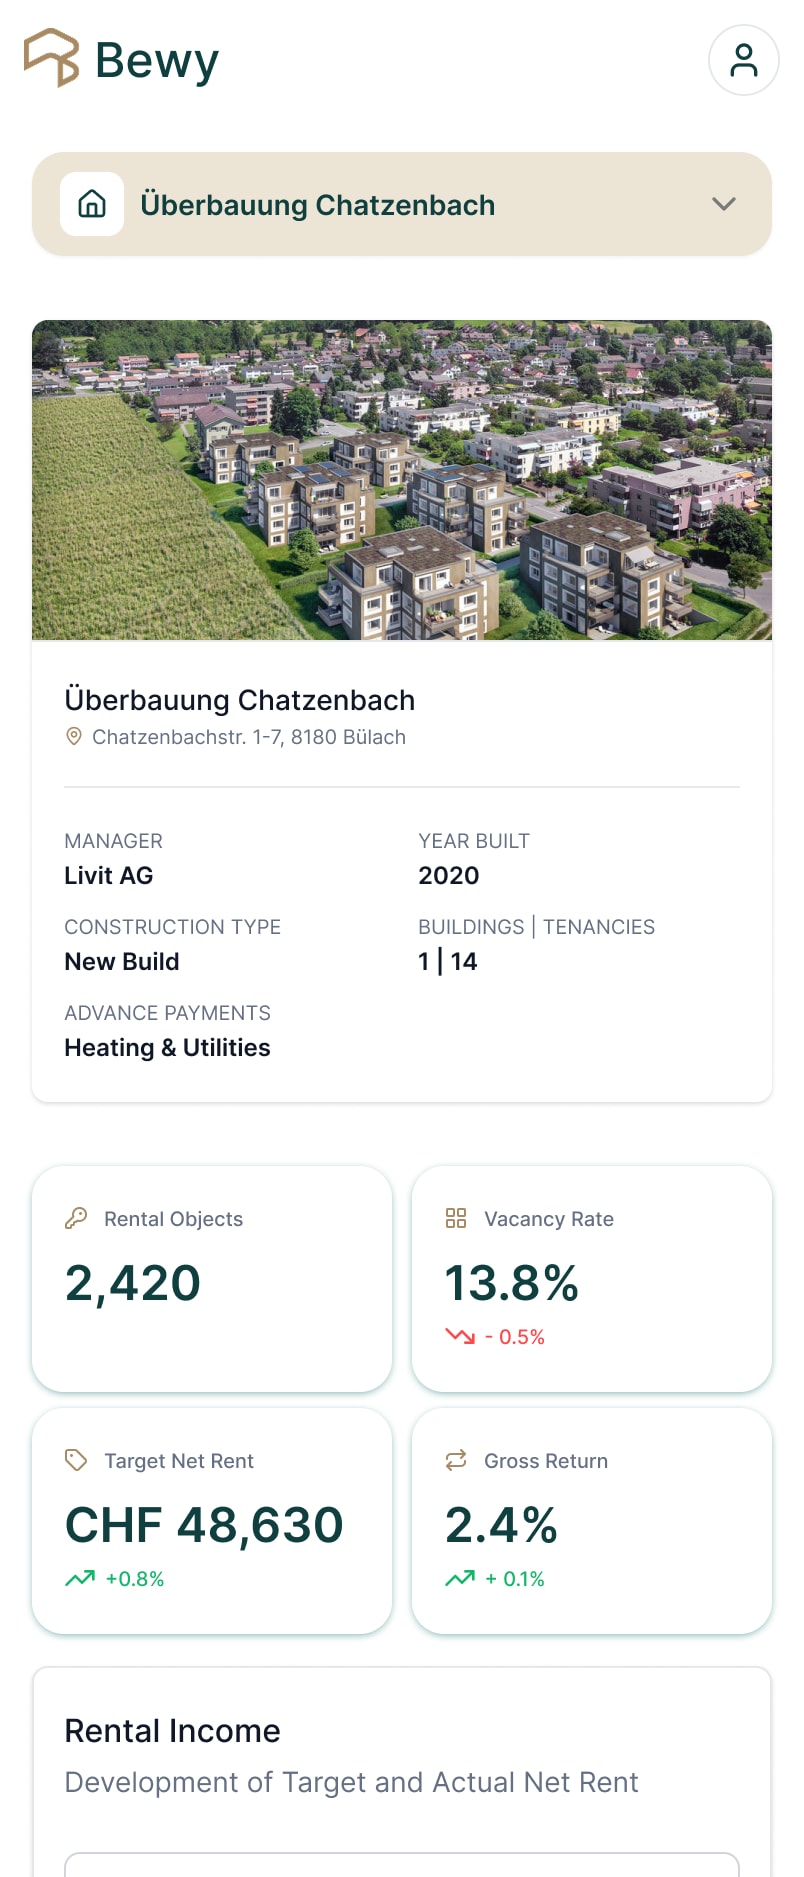
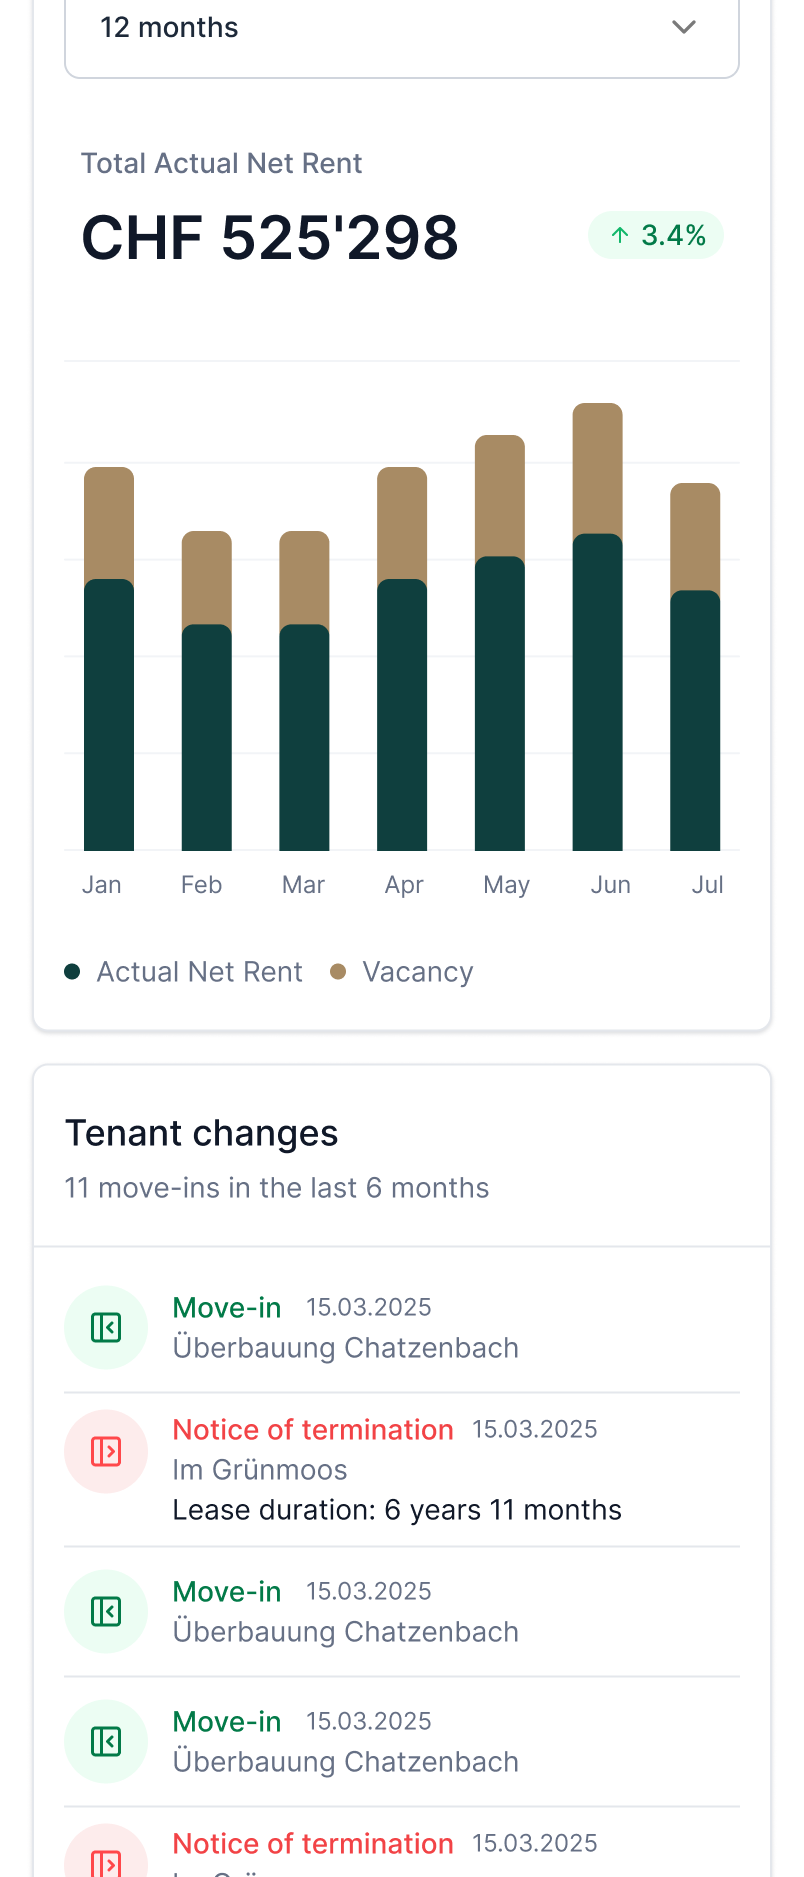

Screen 02
Property
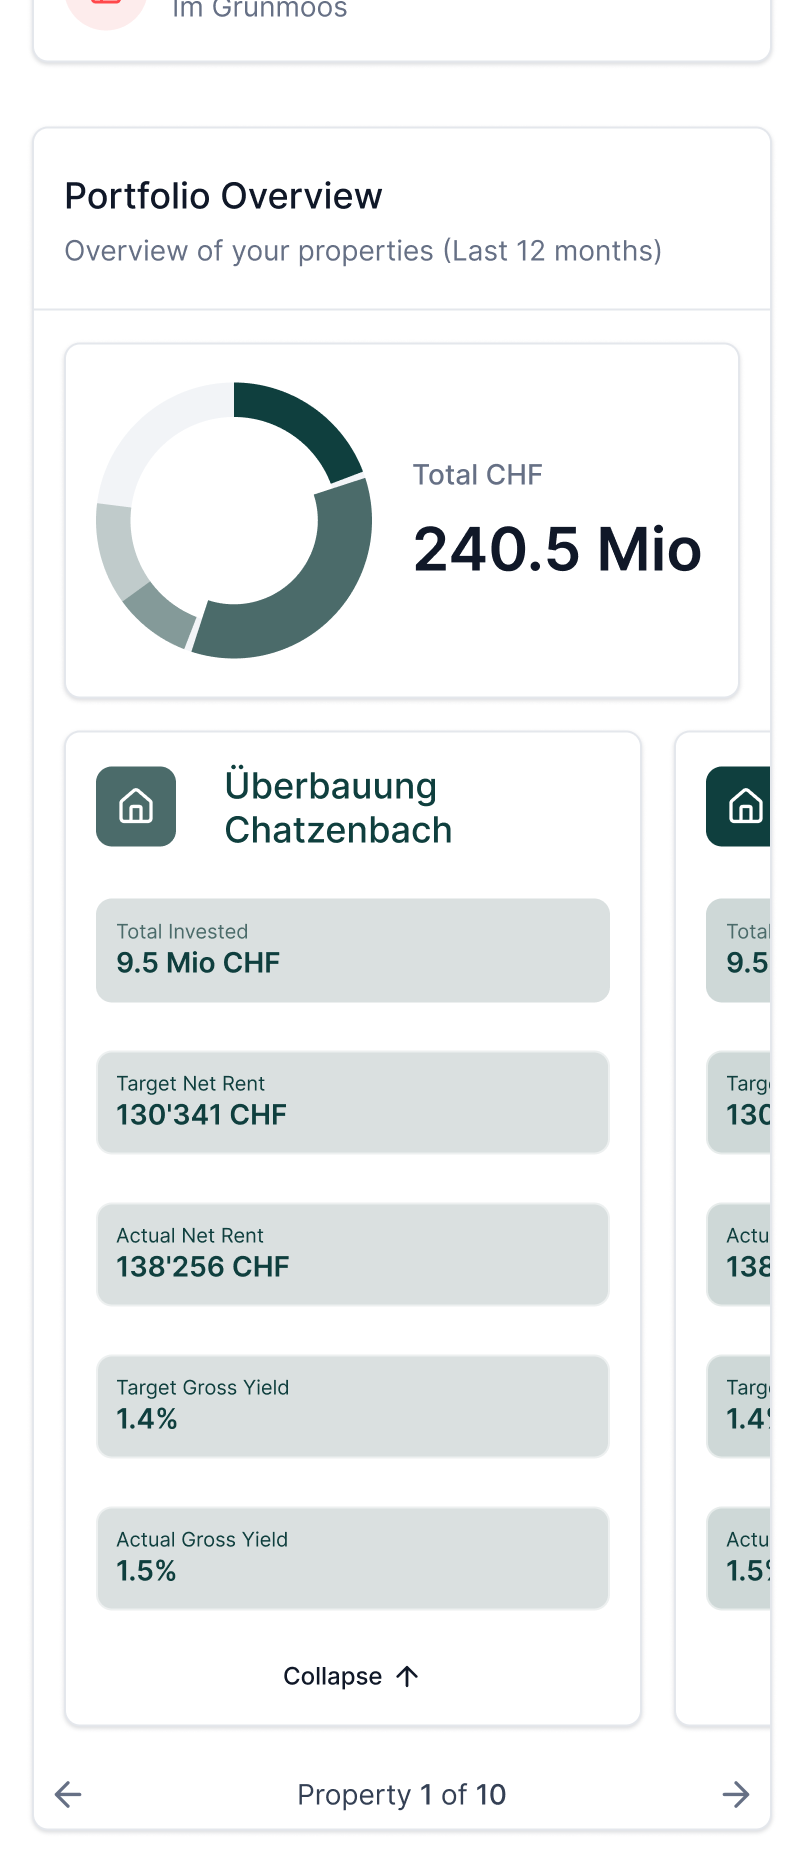
One building in depth: photo and key facts, the same four figures for it alone, income, recent tenant changes and a portfolio overview.

Screen 03
Finances
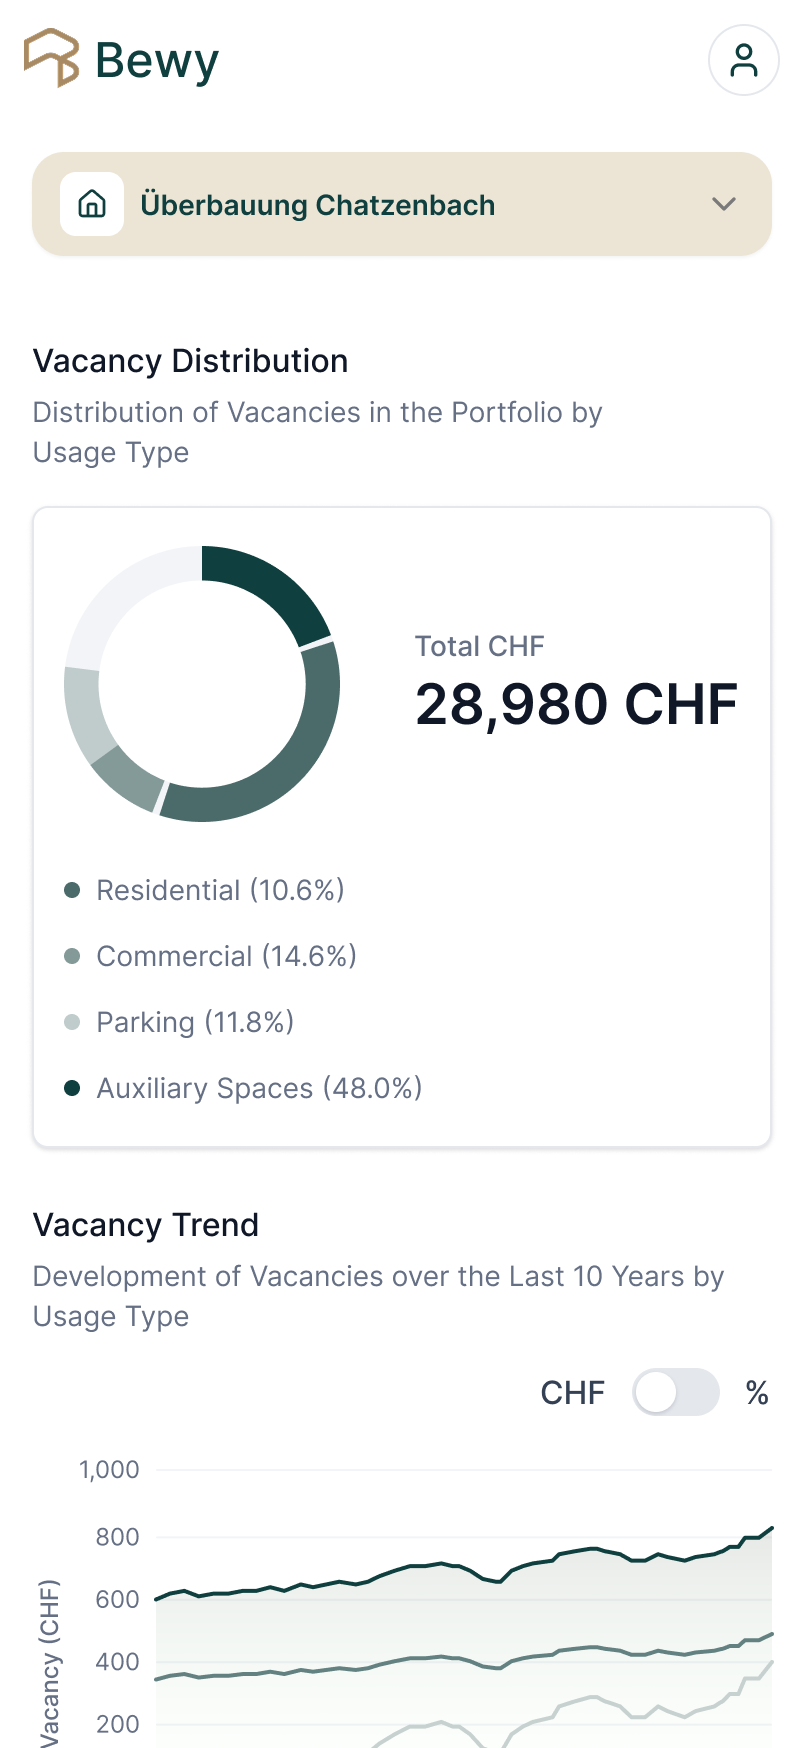
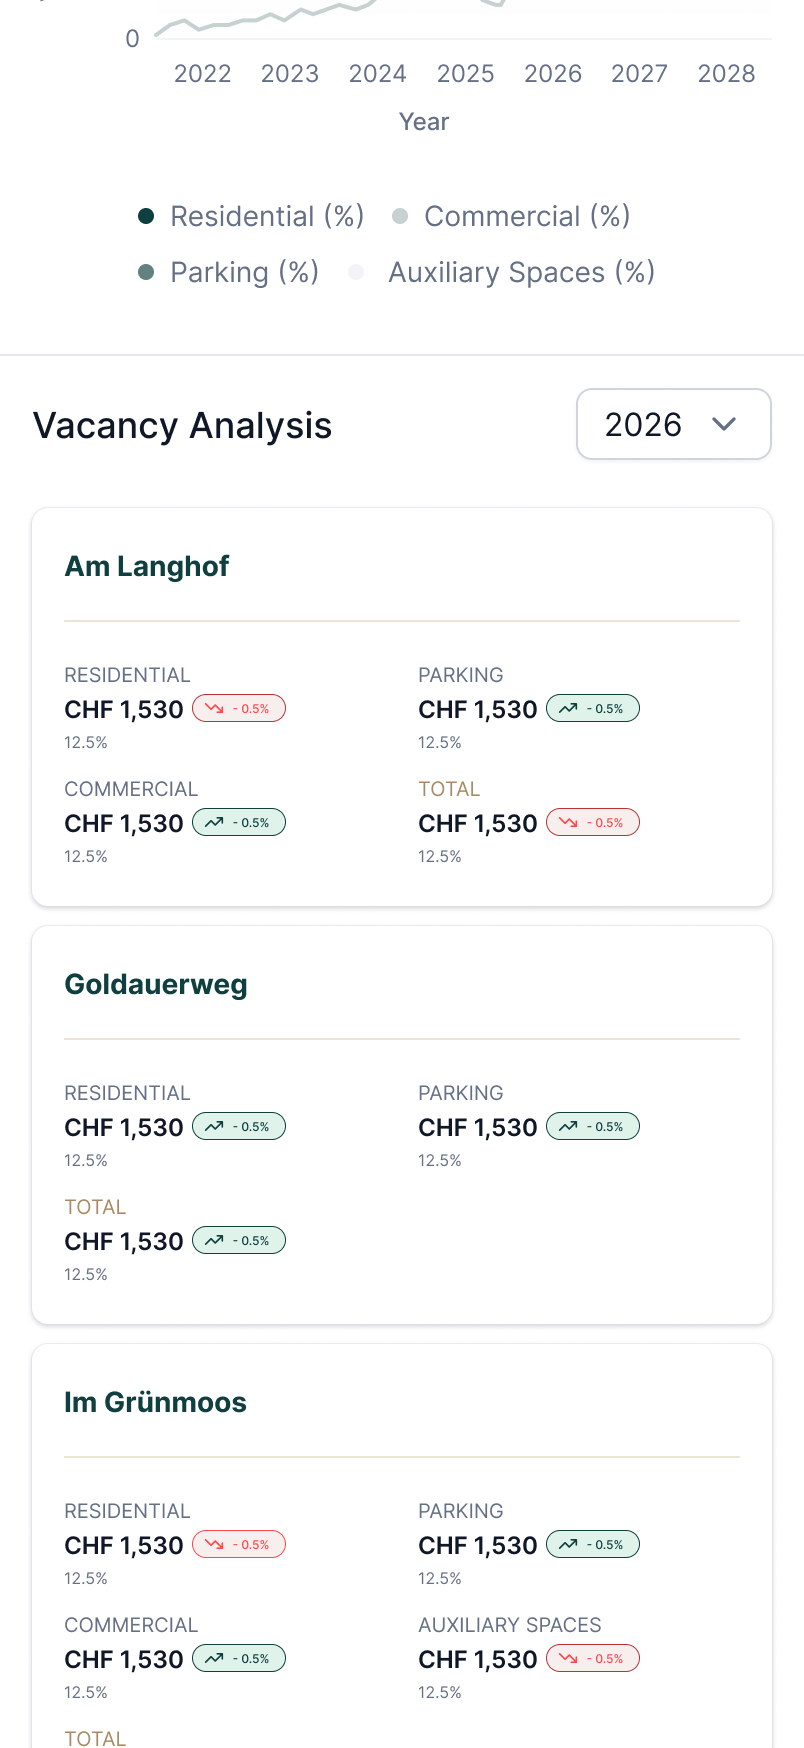
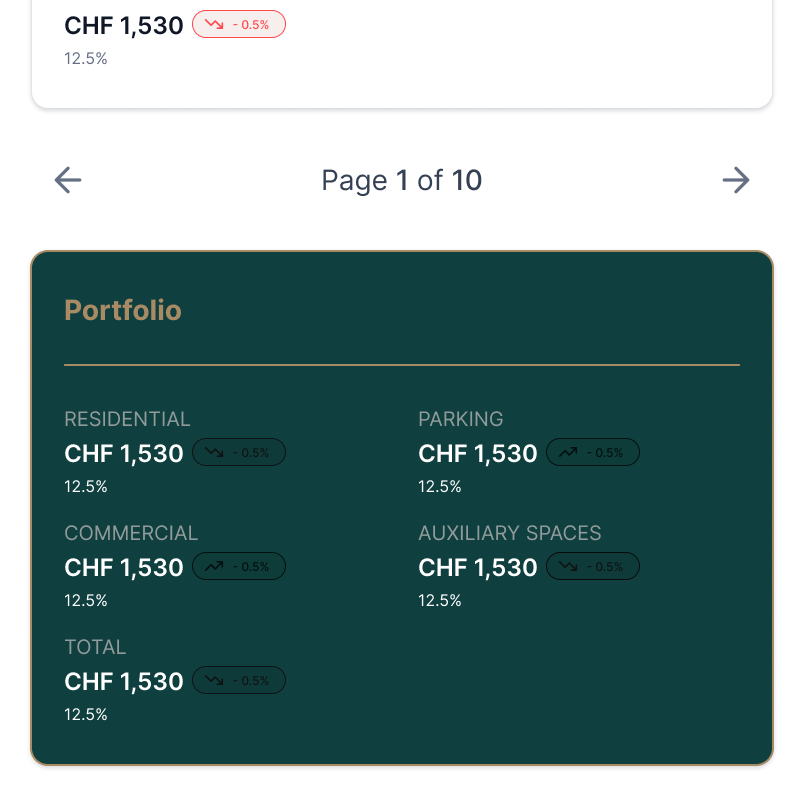
Vacancies made legible: how they split by usage type, a ten-year trend, and a building-by-building analysis.